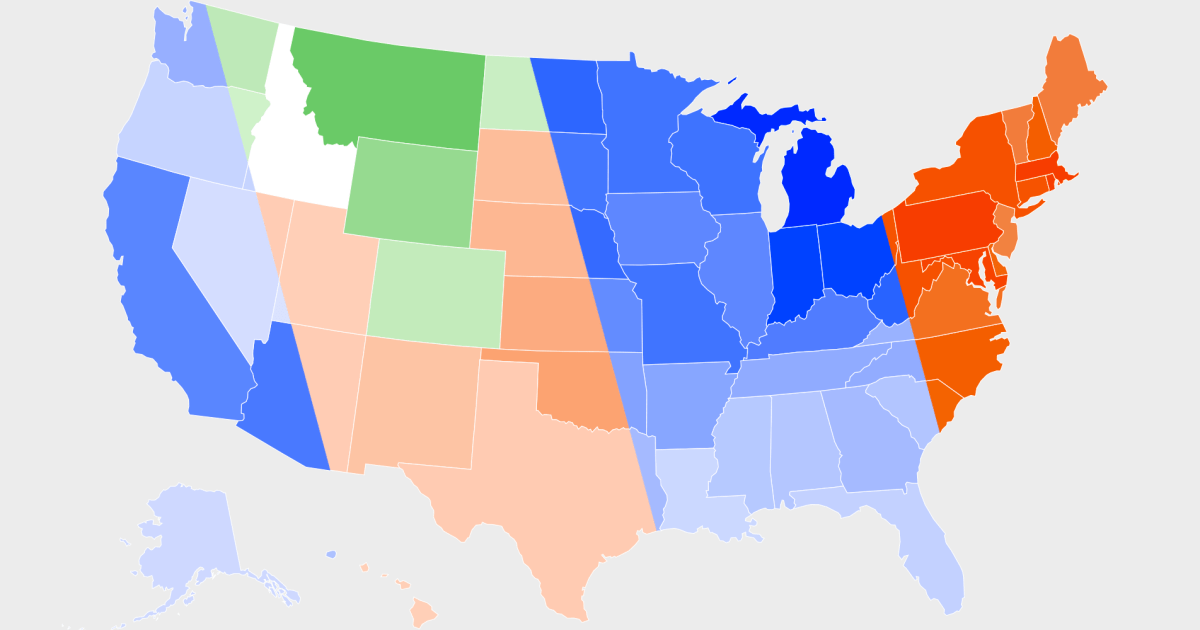
Covid-19 hospitalizations are once again ticking upward after a lull in October and early November, with tens of thousands more Americans filling hospital beds across the country in the past four weeks.
The increase is particularly noticeable in certain Midwestern and mid-Atlantic states. As of Tuesday Jan. 4, Washington, D.C.'s population-adjusted rate is highest in the nation, followed by Ohio, Delaware and Indiana.
States in the South are seeing the largest change in hospitalizations in the past two weeks.
Track the hardest-hit states with this NBC News analysis of U.S. Department of Health and Human Services Covid hospitalizations data. This article will be updated daily.
Hospitalization hot spots
First map: Covid hospitalization rates by state. Second map: Where hospitalizations have risen the most.


Recent Comments